SPSS Output – Basics, Tips & Tricks
 Exporting SPSS output is usually easier and faster than copy-pasting
SPSS Output Introduction
In SPSS, we usually work from 3 windows. These are
- the data editor window
 ;
; - the syntax editor window
 ;
; - the output viewer window
 .
.
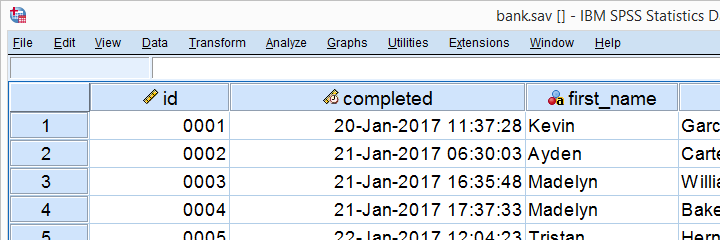
Our previous tutorials discussed the data editor and the syntax editor windows. So let's now take a look at the output viewer. We suggest you follow along by downloading and opening bank.sav, part of which is shown below.
SPSS Output - First Steps
Right. So with our data open, let's create some output by running the syntax below.
frequencies educ marit jtype
/barchart
/order variable.
Running this syntax opens an output viewer window as shown below.
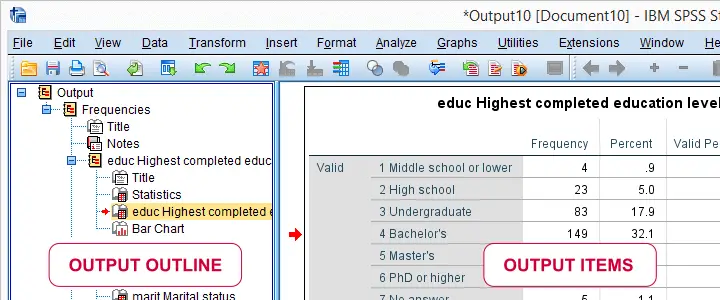
As illustrated, the SPSS output viewer window always has 2 main panes:
- the output outline is mostly used for navigating through your output items and
- the actual output items -mostly tables and charts- are often exported to WORD or Excel for reporting.
In the output outline, you can also delete output items -SPSS often produces way more output than you ask for. Use the ctrl key to select multiple items. A faster way for deleting a selection of output items is OUTPUT MODIFY.
You can also collapse and reorder output items in the outline but I don't find that too useful. So let's turn to the actual output items. The most important ones are tables and charts so we'll discuss those separately.
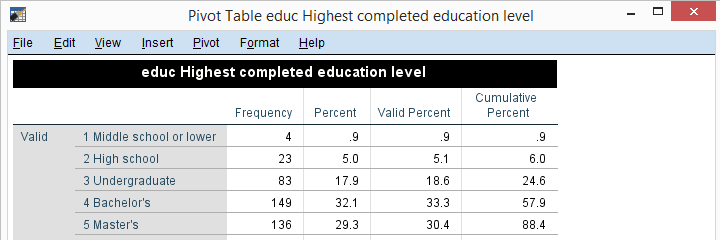
SPSS Output - Tables
We'll usually want to make some adjustments to our output tables. One option for doing so is right-clicking the table and selecting
![]() as shown below.
as shown below.
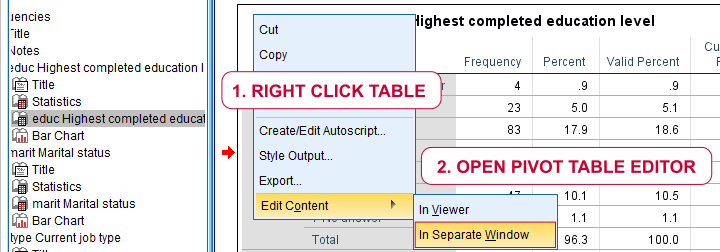
The pivot table editor window (shown below) allows us to adjust basically anything about our table.
That being said, we recommend you only use the pivot table editor if everything else fails. One reason is that you can't replicate and rerun whatever you do in the pivot table editor. And more importantly, there are faster options with which you can adjust many tables in one go. So let's explore some of those.
Variable and Value Labels in Output Tables
When I'm inspecting my data, I want to see variable names and labels in my output. The same goes for values and value labels because I want to know how my variables have been coded.
However, I want to see only labels in the final tables that I'll report. One way for doing so is navigating to
![]() and selecting the tab.
and selecting the tab.
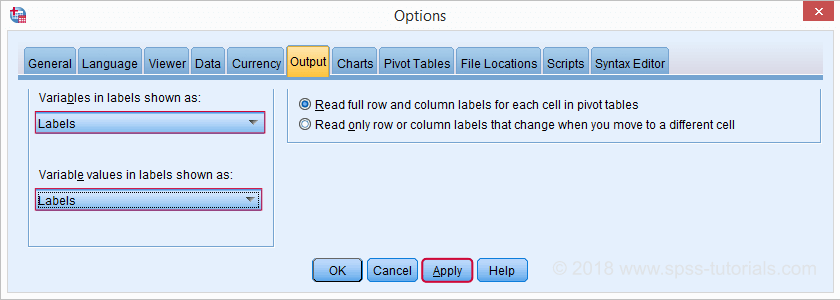
Oddly, the options dialog has no button. This is because it creates very messy syntax. A much better option for this than the crappy menu is just running the syntax below.
set
tnumbers labels
tvars labels.
- TVARS is short for ”table variables”. It sets how variables are shown in tables: names, labels or both;
- TNUMBERS is short for “table numbers”. It sets how values are shown in tables: values, labels or both.
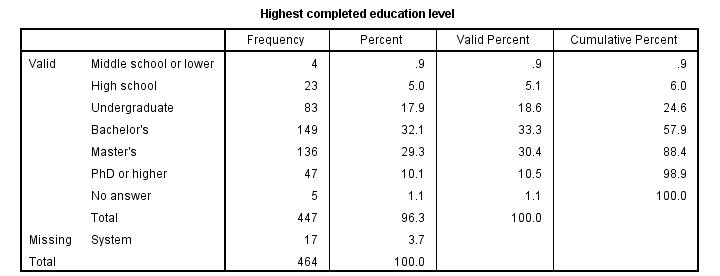
Running this syntax is a much better option than using the aforementioned menu. After doing so, all output tables we'll run will show only variable and value labels.
SPSS Table Templates
Another thing I don't like about these tables is their styling: grey fonts with grey backgrounds. The best way to fix this is setting a tablelook before running any tables. Running set tlook 'C:\Program Files\IBM\SPSS\Statistics\24\Looks\Original.stt'. does the trick for me. On your computer, you may need a slightly different path. If I now rerun my frequency distributions, they'll look much nicer as shown below.
Right. So those are the main basics regarding output tables. Let's now turn to our charts.
SPSS Output - Charts
First off, you can adjust basically anything about charts in the chart editor window. You can open one by right clicking a chart as shown below.
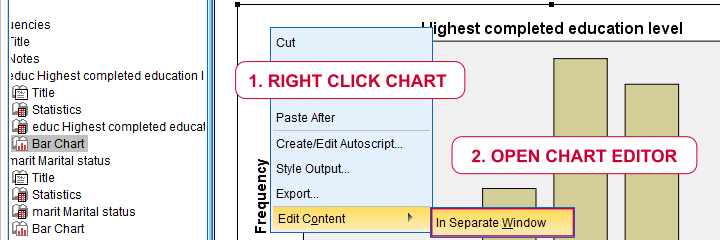
This opens a chart editor window as shown below.
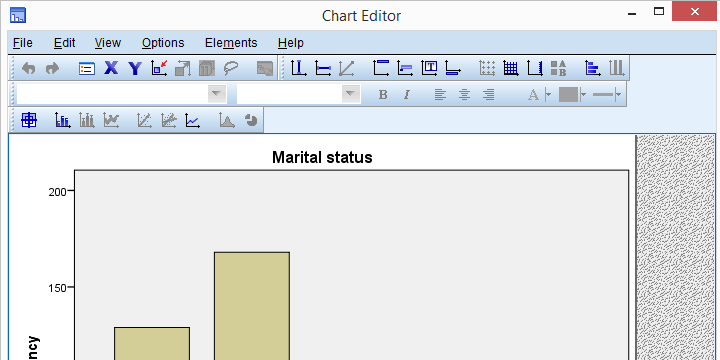
As a rule of thumb, only use the chart editor if everything else fails. There's better ways to adjust charts than using the chart editor window. So let's explore some of those.
SPSS Chart Templates
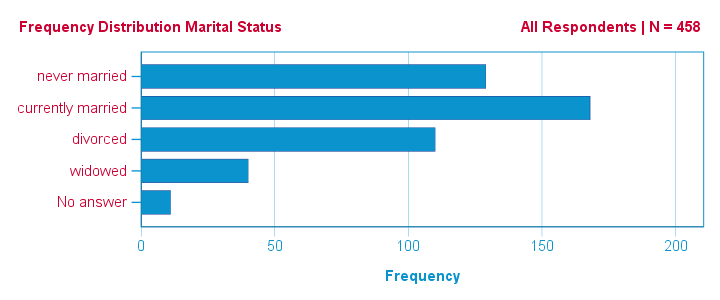
You can apply styling -colors, borders, sizes and so on- to charts by setting a chart template before running any charts. The proper way to do so is running something like SET CTEMPLATE 'C:\Program Files\IBM\SPSS\Statistics\24\Looks\sometemplate.sgt'. After doing so, all of our bar charts look as shown below. If you have some nice chart templates, it's a matter of seconds to have all of your charts look great.
SPSS - All Output to WORD
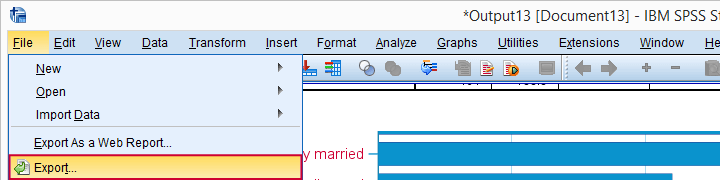
A great way to convert SPSS output to WORD is exporting all contents of the output viewer in one go. You can do so by navigating to
![]() as shown below.
as shown below.
Selecting the options below results in a WORD document containing all tables and charts shown in your output viewer. This is the ideal starting point for writing your report.
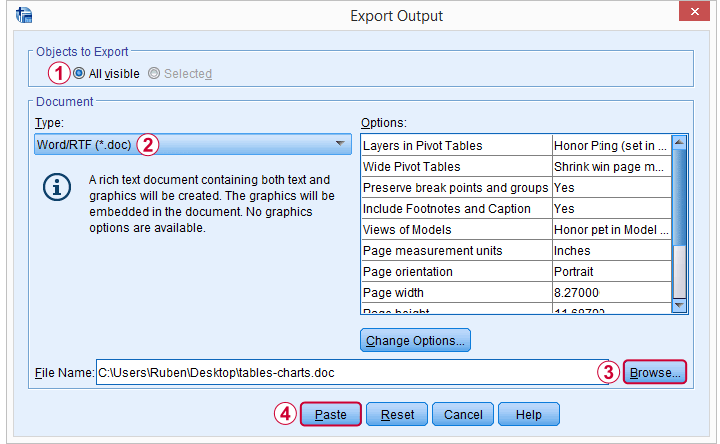
Since you can batch edit tables and charts in SPSS -but not in WORD- make sure your output is as good as it gets before converting it. A great way to adjust tables and delete unwanted output items is OUTPUT MODIFY.
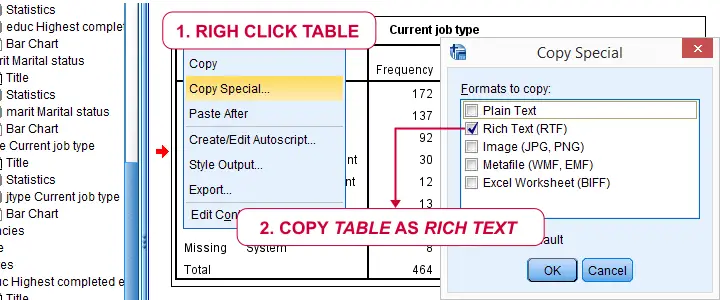
Copy-Pasting SPSS Output Tables to WORD
If you need only a handful of output items in WORD, you can also just copy-paste them. The ctrl + c and ctrl + v shortkeys usually work fine for both tables and charts. If it fails, however, use copy special for tables as shown below.
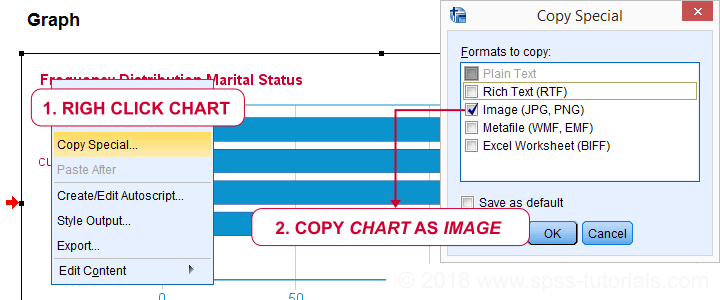
The same goes for copy-pasting charts to WORD: first try ctrl + c. If that doesn't work, copy the chart as an image as shown below.
SPSS - All Output to Excel
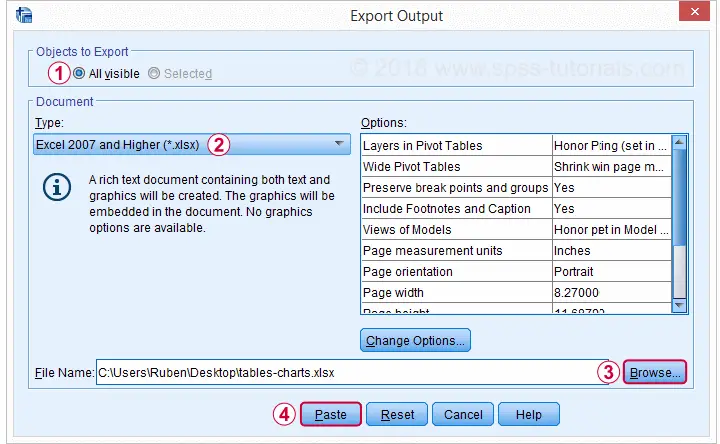
You can convert all contents of your output window -including all tables and charts- in one go to a single Excel sheet. For doing so, navigate to
![]() and select the options shown below.
and select the options shown below.
Copy-Pasting SPSS Output Tables to Excel
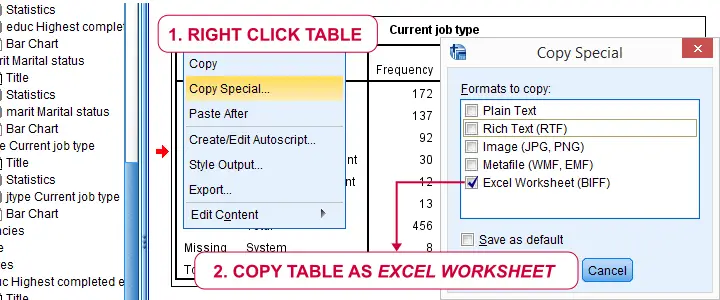
If you need just a couple of output tables in Excel, you can copy-paste them with the ctrl + c and ctrl + v shortkeys. If that fails, use copy special as Excel worksheet as shown below.
SPSS Output Tricks
SPSS users tend to waste a lot of time and effort on manually adjusting output items. The easiest way for doing so -like discussed- is using the pivot table editor and chart editor windows. We also suggested to use these only if everything else fails. So which are better -and especially faster- alternatives?
- Try to style tables with tablelooks. These can apply fonts, borders, colors, text-alignment and more to one or many tables. To some extent, table templates can also hide table elements such as titles and captions.
- For styling charts, use chart templates. These can also hide chart elements such as titles and labels.
- You can apply numeric formats -and hence set decimal places- to a selection of table columns, rows or cells with OUTPUT MODIFY. It can also apply conditional formatting -such as boldface or italicize- table cells or delete a selection of output items.
- You can convert one or many output tables to a single SPSS dataset by using the OMS. You can further process this dataset in SPSS and/or save it as Excel or some other format. OMS is easy to use from the menu. It can also suppress a selection of output items: warnings, case processing summaries and so on.
- You can edit almost anything for one or many output items with Python scripting. This is harder to use and works slower than OUTPUT MODIFY. However, it accomplishes much more. For an example, see SPSS Correlations in APA Format.
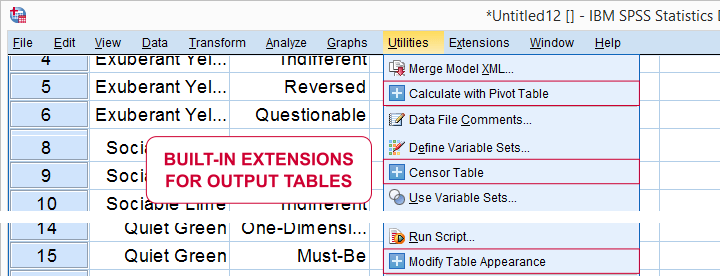
- Several table adjustments can be made from extensions that are built into recent SPSS versions with the SPSS Python Essentials installed. Most are based on Python scripting and are found under as shown below.
SPSS Output - Final Notes
Right, so that'll do for introducing SPSS output. I hope we clarified some basics. Some of the output tricks may be suitable only for experienced or even expert SPSS users. However, I thought you should at least be aware that they exist.
Thanks for reading!
SPSS Syntax Introduction
Contents
SPSS syntax is a language containing instructions for
analyzing and editing data and other SPSS commands.
- How to paste SPSS syntax?
- How to run SPSS syntax?
- Writing simpler syntax
- How to get SPSS syntax?
- Why even use SPSS syntax?
SPSS users working directly from the menu may not actually see they syntax they're running. However, this is a terrible practice and we'll explain why in a minute. So let's download and open bank.sav -partly shown below- and jump right in.
How to paste SPSS syntax?
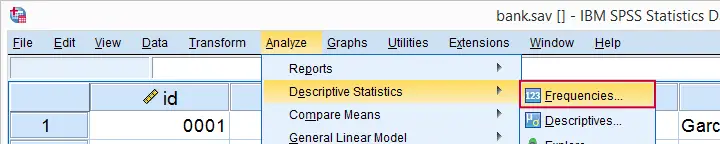
Now let's suppose I'd like to gain some insight into the percentages of male and female respondents. I could first navigate to
![]()
![]() as shown below.
as shown below.
I'll now  move gender into the variable box and perhaps
  request a bar chart as well.
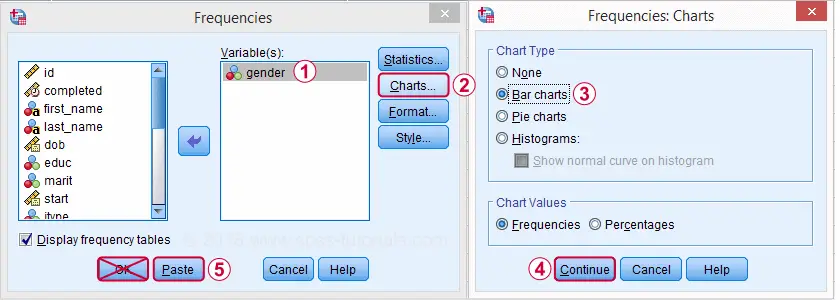
Now clicking may seem the obvious thing to do. A much better idea, however, is to click the button. Upon doing so, a new SPSS window opens which is known as the Syntax Editor. It's recognized by the orange icon ![]() in its left top corner.
in its left top corner.
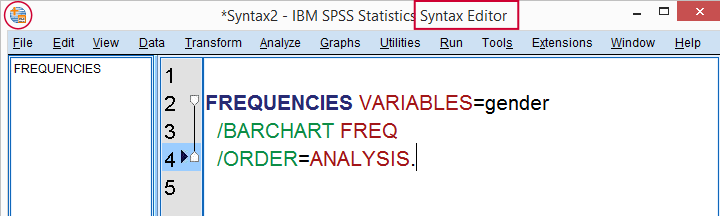
The Syntax Editor contains a FREQUENCIES command which holds the instructions we just gave SPSS in the Frequencies dialog. However, we don't see the frequency distribution and bar chart we asked for. This is because we still need to run the command we just created.
How to run SPSS syntax?
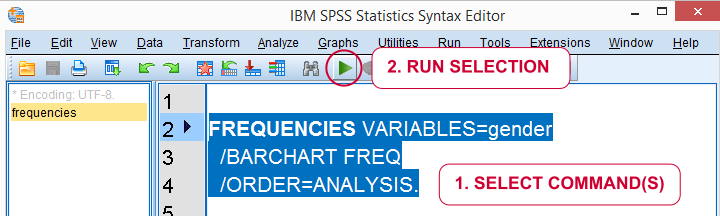
The simplest way to run syntax is to select the command(s) you'd like to run and click the “run selection” icon ![]() in your toolbar.
in your toolbar.
A faster way to run syntax is to use several shortkeys, especially
- F2 for selecting the command in which your mouse pointer is located;
- Ctrl + a for selecting all syntax;
- Ctrl + r for running all selected commands.
So let's now run our pasted syntax. On doing so, a new window will open, containing our frequency table and barchart. This is an output window which we'll discuss in our next tutorial.
How to get SPSS syntax?
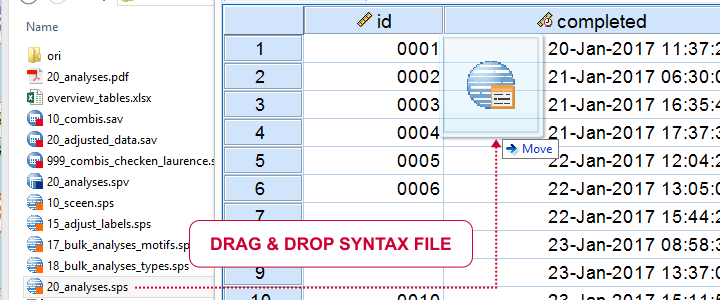
The right way to do basically anything in SPSS -editing and analyzing data, creating tables and charts and more- is by running syntax. So how to get syntax? First off, using the button from the menus adds syntax to your syntax window. If you don't have a syntax window open yet, it'll open one for you. Options for opening a syntax window are
- using the button from the menus;
- drag and drop a syntax file into the Data Editor window (shown below);
- clicking the New Syntax
 toolbar icon;
 - Navigate to
 .
.
If you've a syntax window open, you still need the actual syntax. Options to get the syntax you need are
- use the button from SPSS’ menu;
- copy-paste syntax from our tutorials, online forums and elsewhere;
- type the commands you need into the syntax window.
Now, typing syntax may seem like a crazy thing to do at this point. However, typing syntax is much easier than it seems because most of it can be dramatically simplified.
Writing simpler syntax
The syntax we just pasted from the menu was:
/BARCHART FREQ
/ORDER=ANALYSIS.
Now typing all that manually is a lot of work. However, we'll get the exact same results if we run:
/barchart.
Just typing and running this is much faster and easier than clicking through all menu options. So if you want to get real good -and real fast- with SPSS, start learning short syntax. This will take some practice but it will save you tons of time and effort in the longer run.
SPSS Syntax Files
We can now save all contents of our Syntax Editor as a syntax file by going to
![]() The resulting syntax file has the .sps (for “SPSS syntax”) file extension and is a plain text file. You can open, edit and save it with SPSS or any text editor such as Notepad++.
The resulting syntax file has the .sps (for “SPSS syntax”) file extension and is a plain text file. You can open, edit and save it with SPSS or any text editor such as Notepad++.
When saving syntax in newer SPSS versions, something like
* Encoding: UTF-8.
may be added. Just leave and ignore this, it's not meant for you but, rather, some kind of “note to self” from SPSS.
Why even use SPSS syntax?
The single best SPSS practice is doing everything from syntax. Some reasons for this are
- you'll always know exactly which steps you took in which order so you can prove that your results are correct;
- if you made some mistake -don't we all sometimes?- you can correct it and rerun everything you did in just seconds;
- you'll work way faster than from the menu and you never have to do things twice;
- some of the best SPSS tricks and time savers are available as syntax only.
So say you run 10 tables and charts from the menu. And then you realize you should have filtered out all respondents working in IT. Now you have to start all over again: remove the unwanted respondents and click your way through all the same menus and dialogs again...
Sounds like a terrible idea. Doesn't it?
Unfortunately, I see students having to do days of SPSS work all over again on a daily basis. Not working from syntax really is the very worst SPSS practice.
So say I run those 10 tables and charts and I saved all syntax. Then I realize I should have filtered out all respondents working in IT. Ok. No problem. I'll just add
SELECT IF (jtype <> 3).
to the top of my syntax and rerun all tables and charts in one go.
Thanks for reading!
SPSS Data Editor Window
In SPSS, we usually work from 3 windows. These are
- the data editor window ;
- the syntax editor window ;
- the output viewer window .
SPSS’ main window is the data editor. This is the only window that's always open when we run SPSS. Although it's called “data editor”, we use it only for inspecting our data. We strongly recommend you
never edit data in the data editor.
The right way to edit data -and way faster too- is by using syntax, which we'll discuss in the next tutorial.
Right, let's now download and open bank.sav. We'll use it for walking you through the main parts of the data editor.
SPSS Data View & Variable View
An SPSS data file always has two tabs in the left bottom corner:
- Data View is where we inspect our actual data and
- Variable View is where we see additional information about our data.
You can switch between Data View and Variable View by
- clicking the tabs in the left bottom corner;
- using the Ctrl + t shortkey;
- double-clicking a variable name in Data View;
- double-clicking an outline number in Variable View.
Let's first take a close look at the main parts of the Data View tab. We'll then proceed with variable view.
SPSS Data View
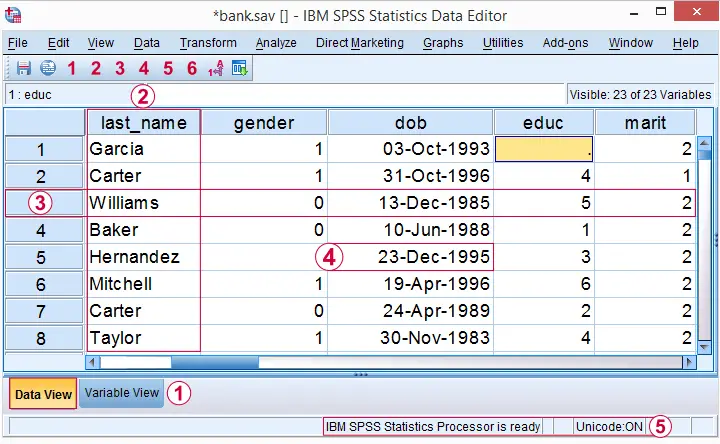
The data editor has tabs for switching between Data View and Variable View. For now, make sure you're in Data View.
 Columns of cells are called variables. Each variable has a unique name (“gender”) which is shown in the column header.
Rows of cells are called cases. Oftentimes, each respondent in a study is represented as a single case.
 In SPSS, values refer to cell contents.
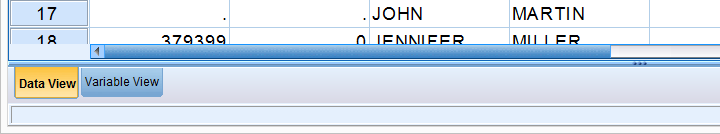
 The status bar may give useful information on the data, for instance whether a WEIGHT, FILTER, SPLIT FILE or Unicode mode is in effect.
These are the main elements in Data View. Let's now switch to Variable View.
SPSS Variable View
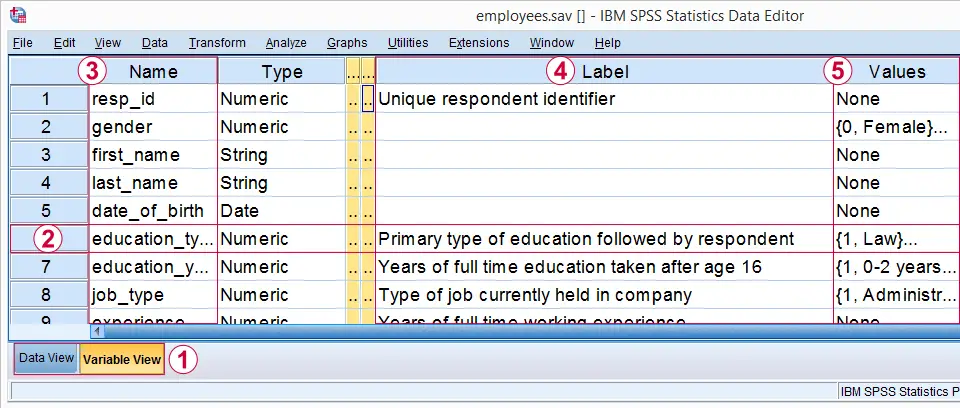
In the left bottom corner we find tabs for switching between Variable View and Data View. For now, select Variable View.
In Variable View, variables are shown as rows of cells.
The first column shows the variable name for each variable.
The fifth column may or may not contain a variable label. This describes the exact meaning of each variable.
The sixth column shows value labels: descriptions of the meaning of one, many or all values that a variable may contain.
In short, Variable View does not show the data itself but, rather, information about the data. This is sometimes called “metadata” or “the codebook”. In SPSS, however, it's called the dictionary.
This is important to know because you may find commands like DISPLAY DICTIONARY or APPLY DICTIONARY in manuals. If you're familiar with syntax, running
DISPLAY DICTIONARY.
creates the output shown below: dictionary information as seen in variable view.
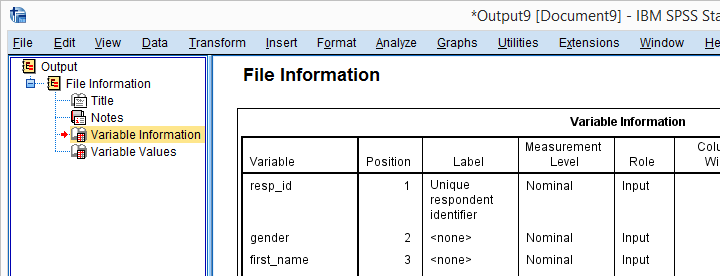 Dictionary information reported by running DISPLAY DICTIONARY.
Variable View - Value Labels
For some variables, it's immediately clear what their values mean: a value of € 2500,- in a variable “gross monthly income” represents a gross monthly income of € 2500,-.
This is not always the case, however: answer categories for categorical variables are often represented by numbers -usually 1 through x. What these values represent is then stored in their value labels. Clicking the open value labels icon ![]() for education_type displays all value labels for this variable.
for education_type displays all value labels for this variable.
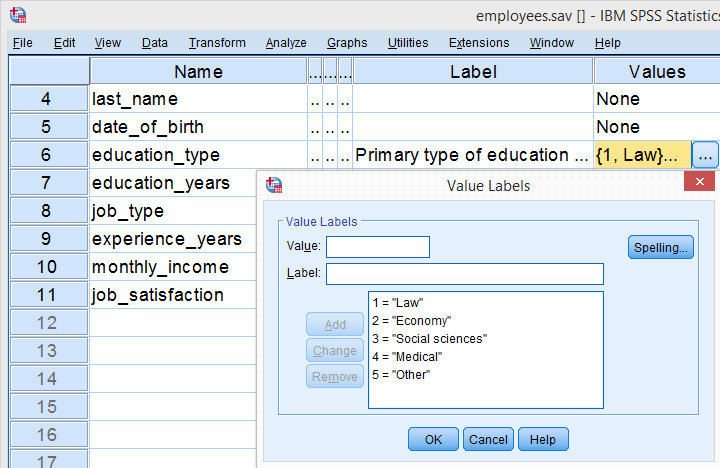 Value labels for education_type.
These value labels tell us that a person with a value of 1 on education_type indicates somebody who studied “Law”. In a similar vein, “Economy” is represented by a value of 2, and so on.
Dictionary Information in Data View
Thus far, we explained that SPSS’ Data Editor always has 2 tabs:
- Data View in which we inspect our actual data values and
- Variable View in which we find information about our data -dictionary information.
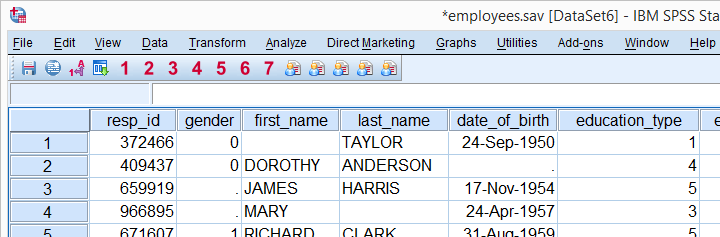
Little known by many SPSS users is that we can see some dictionary information in Data View too. Let's start off with value labels. Initially, we just see data values in Data View as shown below.
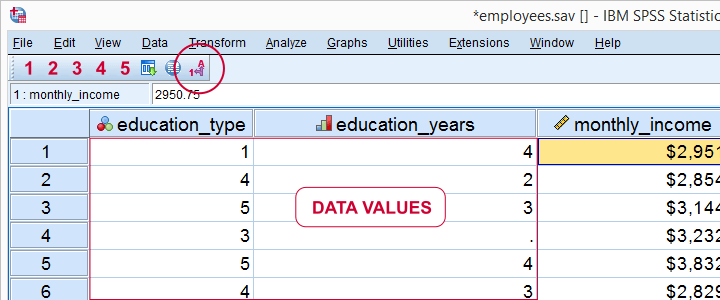
Now, if we click the value labels icon ![]() we'll see value labels instead of data values in data view.
we'll see value labels instead of data values in data view.
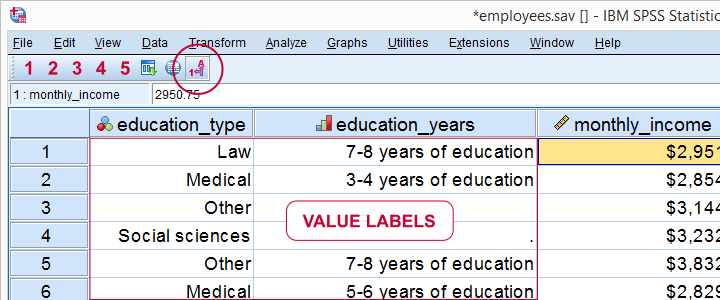
So this allows you to look up what your data mean without having to switch between Data View and Variable View. Perhaps even more useful: place your mouse pointer on a variable name in Data View without clicking it. Now a yellow box with a lot of dictionary information pops up for a few seconds.
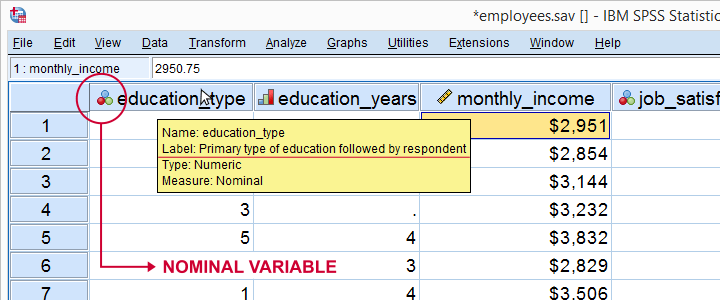
Starting from SPSS version 22, icons next to variable names tell us something about our variable types, formats and measurement levels -if correctly set, that is.
Final Notes
So basically, “data” consist of 2 components:
- data values which we see in Data View and
- dictionary information about our data in Variable View.
We can save the contents of the Data Editor as an SPSS data file or .sav file. If we do so, the resulting file always contains everything in both Data View and Variable view.
Let's reemphasize that you should never -under no circumstances- edit anything manually in either Data View or Variable View. This is perhaps the single worst SPSS practice. And yes, I know. Many SPSS users do this anyway. But most will sooner or later wish they hadn't.
The only sound way to edit your data or dictionary information is by syntax. So let's move on to our next tutorial: SPSS Syntax Introduction.
Thanks for reading.
SPSS – What Is It?
SPSS means “Statistical Package for the Social Sciences” and was first launched in 1968. Since SPSS was acquired by IBM in 2009, it's officially known as IBM SPSS Statistics but most users still just refer to it as “SPSS”.
SPSS - Quick Overview Main Features
SPSS is software for editing and analyzing all sorts of data. These data may come from basically any source: scientific research, a customer database, Google Analytics or even the server log files of a website. SPSS can open all file formats that are commonly used for structured data such as
- spreadsheets from MS Excel or OpenOffice;
- plain text files (.txt or .csv);
- relational (SQL) databases;
- Stata and SAS.
Let's now have a quick look at what SPSS looks and feels like.
SPSS Data View
After opening data, SPSS displays them in a spreadsheet-like fashion as shown in the screenshot below from freelancers.sav.
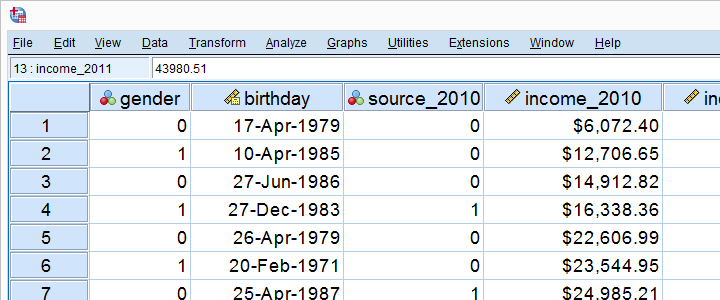
This sheet -called data view- always displays our data values. For instance, our first record seems to contain a male respondent from 1979 and so on. A more detailed explanation on the exact meaning of our variables and data values is found in a second sheet shown below.
SPSS Variable View
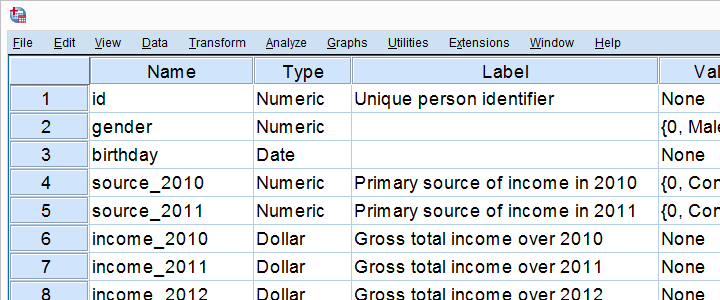
An SPSS data file always has a second sheet called variable view. It shows the metadata associated with the data. Metadata is information about the meaning of variables and data values. This is generally known as the “codebook” but in SPSS it's called the dictionary.
For non SPSS users, the look and feel of SPSS’ Data Editor window probably come closest to an Excel workbook containing two different but strongly related sheets.
Data Analysis
Right, so SPSS can open all sorts of data and display them -and their metadata- in two sheets in its Data Editor window. So how to analyze your data in SPSS? Well, one option is using SPSS’ elaborate menu options.
For instance, if our data contain a variable holding respondents’ incomes over 2010, we can compute the average income by navigating to as shown below.
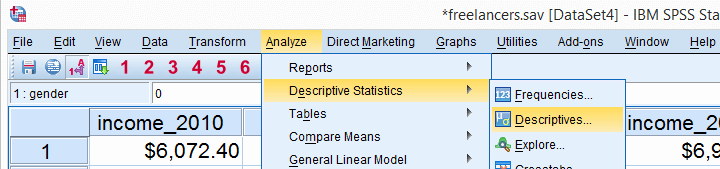
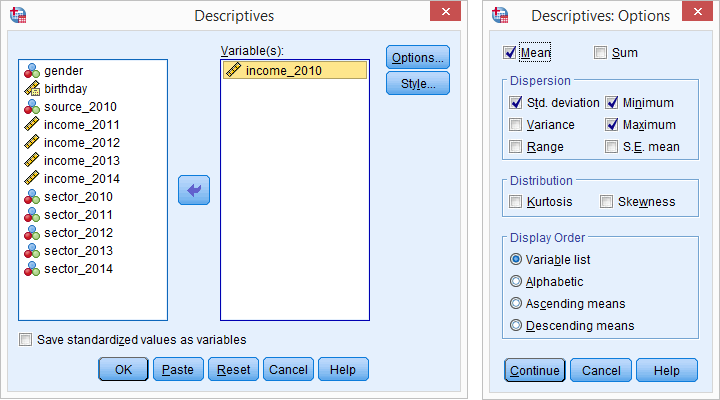
Doing so opens a dialog box in which we select one or many variables and one or several statistics we'd like to inspect.
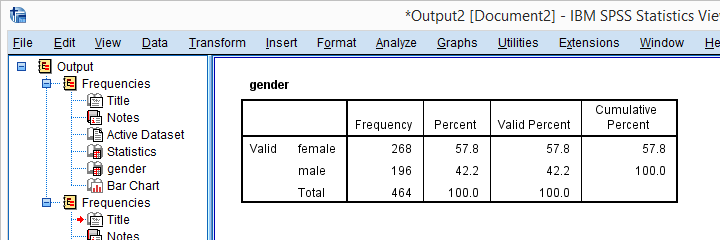
SPSS Output Window
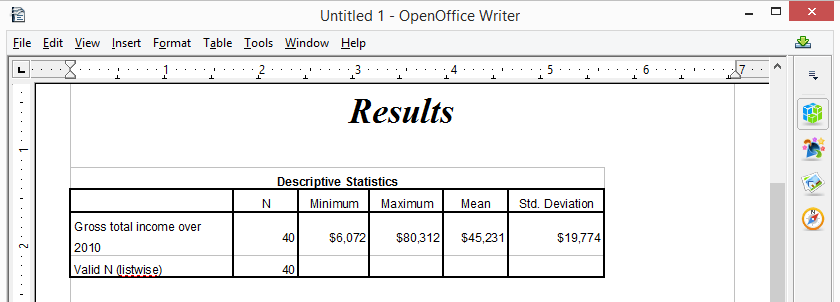
After clicking , a new window opens up: SPSS’ output viewer window. It holds a nice table with all statistics on all variables we chose. The screenshot below shows what it looks like.
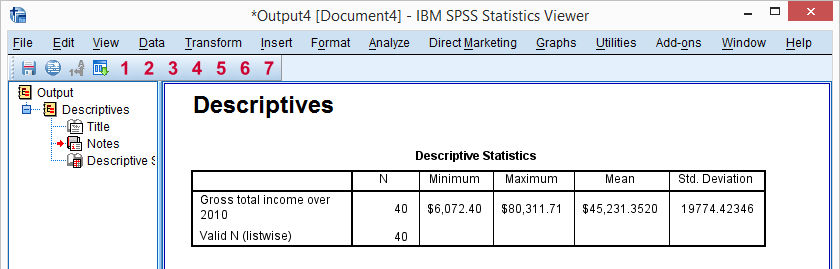
As we see, the Output Viewer window has a different layout and structure than the Data Editor window we saw earlier. Creating output in SPSS does not change our data in any way; unlike Excel, SPSS uses different windows for data and research outcomes based on those data.
For non SPSS users, the look and feel of SPSS’ Output Viewer window probably comes closest to a Powerpoint slide holding items such as blocks of text, tables and charts.
SPSS Reporting
SPSS Output items, typically tables and charts, are easily copy-pasted into other programs. For instance, many SPSS users use a word processor such as MS Word, OpenOffice or GoogleDocs for reporting. Tables are usually copied in rich text format, which means they'll retain their styling such as fonts and borders. The screenshot below illustrates the result.
SPSS Syntax Editor Window
The output table we showed was created by running from SPSS’ menu. Now, SPSS has a second option for running this (or any other) command: we can open a third window, known as the syntax editor window. Here we can type and run SPSS code known as SPSS syntax. For instance, running descriptives income_2010. has the exact same result as running this command from SPSS’ menu like we did earlier.
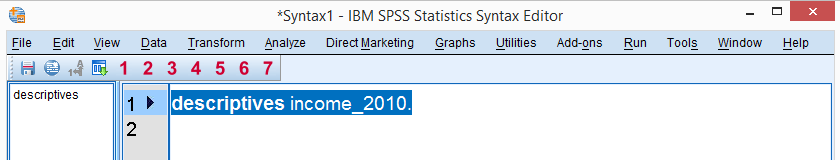
Besides typing commands into the Syntax Editor window, most of them can also be pasted into it by clicking through SPSS’ menu options. Like so, SPSS users unfamiliar with syntax can still use it. But why use syntax if SPSS has such a nice menu?
The basic point is that syntax can be saved, corrected, rerun and shared between projects or users. Your syntax makes your SPSS work replicable. If anybody raises any doubts regarding your outcomes, you can show exactly what you did and -if needed- correct and rerun it in seconds.
For non SPSS users, the look and feel of SPSS’ Syntax Editor window probably come closest to Notepad: a single window basically just containing plain text.
SPSS - Overview Main Features
Now that we have a basic idea of how SPSS works, let's take a look at what it can do. Following a typical project workflow, SPSS is great for
- Opening data files, either in SPSS’ own file format or many others;
- editing data such as computing sums and means over columns or rows of data. SPSS has outstanding options for more complex operations as well.
- creating tables and charts containing frequency counts or summary statistics over (groups of) cases and variables.
- running inferential statistics such as ANOVA, regression and factor analysis.
- saving data and output in a wide variety of file formats.
We'll now take a closer look at each one of these features.
Opening Data Files
SPSS has its own data file format. Other file formats it easily deals with include MS Excel, plain text files, SQL, Stata and SAS.
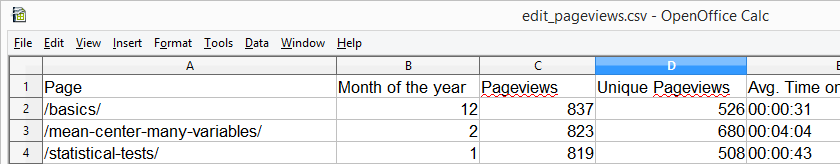 Web analytics data -often downloaded as Excel files- can easily be opened and further analyzed in SPSS
Editing Data
In real world research, raw data usually need some editing before they can be properly analyzed. Typical examples are creating means or sums as new variables, restructuring data or detecting and removing unlikely observations. SPSS performs such tasks -and more complex ones- with amazing efficiency.
For getting things done fast, SPSS contains many numeric functions, string functions, date functions and other handy routines.
Tables and Charts
All basic tables and charts can be created easily and fast in SPSS. Typical examples are demonstrated under data analysis. A real weakness of SPSS is that its charts tend to be ugly and often have a clumsy layout. A great way to overcome this problem is developing and applying SPSS chart templates. Doing so, however, requires a fair amount of effort and expertise.
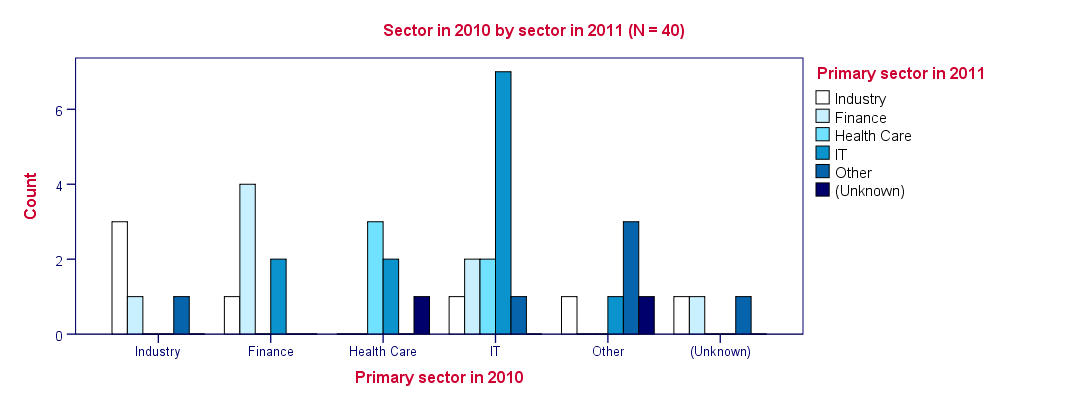 SPSS clustered bar chart with chart template applied
Inferential Statistics
SPSS contains all basic statistical tests and multivariate analyses such as
- t-tests;
- chi-square tests;
- ANOVA;
- correlations and other association measures;
- regression;
- nonparametric tests;
- factor analysis;
- cluster analysis.
Some analyses are available only after purchasing additional SPSS options on top of the main program. An overview of all commands and the options to which they belong is presented in Overview All SPSS Commands.
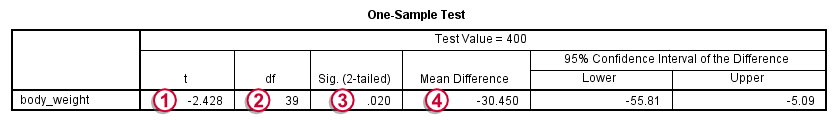 SPSS One Sample T-Test Output Example
Saving Data and Output
SPSS data can be saved as a variety of file formats, including
- MS Excel;
- plain text (.txt or .csv);
- Stata;
- SAS.
The options for output are even more elaborate: charts are often copy-pasted as images in .png format. For tables, rich text format is often used because it retains the tables’ layout, fonts and borders.
Besides copy-pasting individual output items, all output items can be exported in one go to .pdf, HTML, MS Word and many other file formats. A terrific strategy for writing a report is creating an SPSS output file with nicely styled tables and chart. Then export the entire document to Word and insert explanatory text and titles between the output items.
Right, I hope that gives at least a basic idea of what SPSS is and what it does. Let's now explore SPSS in some more detail, starting off with the Data Editor window. We'll present many more examples in the next couple of tutorials as well.
Thanks for reading!